“What is the toughest district?”
This is a question wrestling enthusiasts attempt to answer at the close of every State tournament.
While imbalances are apparent at the district level, the true disparities manifest at the sectional level – which we will delve deeper into during the following discussion.
But first, let’s set the stage by taking a look at the usual metrics used to determine district strength.
State Team Points
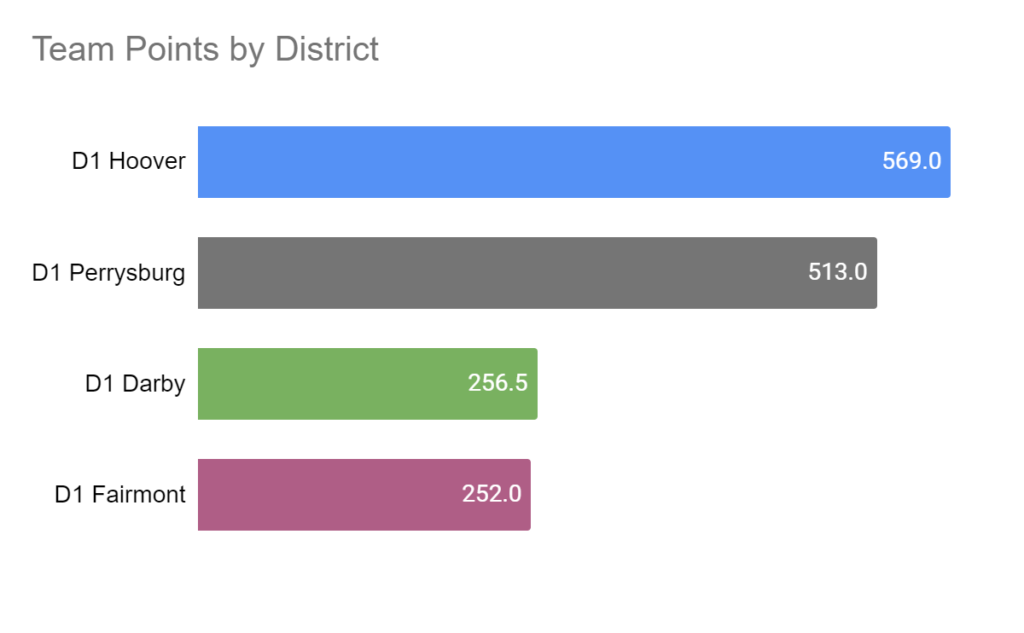
Looking at state team points scored by district uncovers a chasm between the North and the South regions of Ohio.
Northern districts (Hoover and Perrysburg) combined to score 1,082 team points – more than double that of the Southern districts (Darby and Hoover) total of 508.5.
Top Scorers by Team
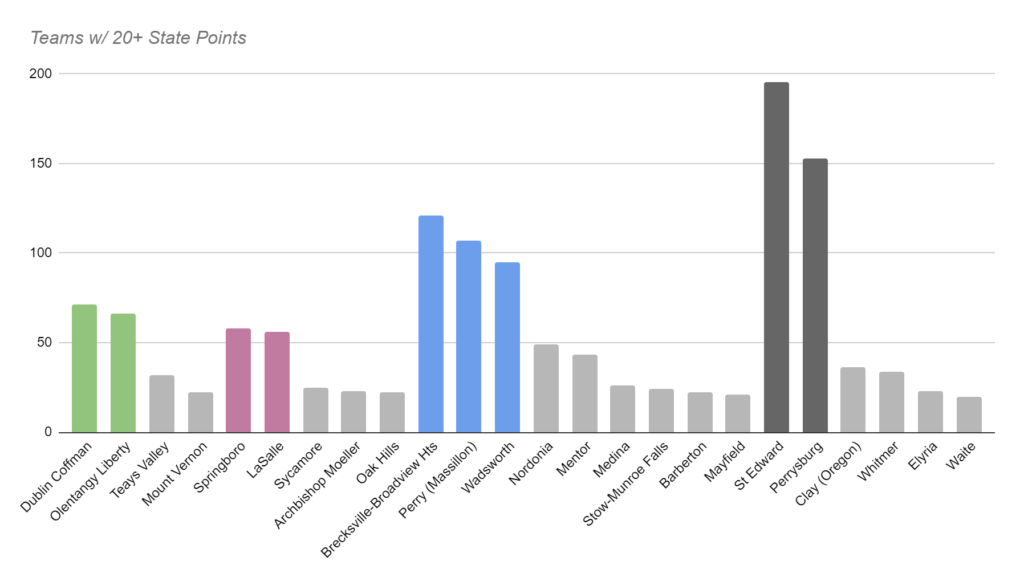
Perrysburg District
The Perrysburg district is top-heavy with #1 St. Ed’s and #2 Perrysburg carrying the load. Together they amassed 348 team points – 68% of their district’s total and over 90 points ahead of Darby and Fairmont’s district totals.
Hoover District
Within the Hoover district, #3 Brecksville, #4 Massillon Perry, and #5 Wadsworth accounted for the majority of the points (323). These three teams outscored both the Darby and Fairmont districts by 60+ points.
Darby District
Darby was buoyed by #6 Dublin Coffman and #7 Olentangy Liberty who combined accounted for about half of their district total.
Fairmont District
#8 Springboro and #9 LaSalle topped the Fairmont district. No other team in this district cracked the top 15 on the state leaderboard.
See the top 15 teams below:
| Place | Team | Score | District |
| 1 | St Edward | 195.5 | D1 Perrysburg |
| 2 | Perrysburg | 152.5 | D1 Perrysburg |
| 3 | Brecksville-Broadview Hts | 121 | D1 Hoover |
| 4 | Perry (Massillon) | 107 | D1 Hoover |
| 5 | Wadsworth | 95 | D1 Hoover |
| 6 | Dublin Coffman | 71 | D1 Darby |
| 7 | Olentangy Liberty | 66 | D1 Darby |
| 8 | Springboro | 58 | D1 Fairmont |
| 9 | LaSalle | 56 | D1 Fairmont |
| 10 | Nordonia | 49 | D1 Hoover |
| 11 | Mentor | 43 | D1 Hoover |
| 12 | Clay (Oregon) | 36 | D1 Perrysburg |
| 13 | Whitmer | 34 | D1 Perrysburg |
| 14 | Teays Valley | 32 | D1 Darby |
| 15 | Medina | 26 | D1 Hoover |
State Placers
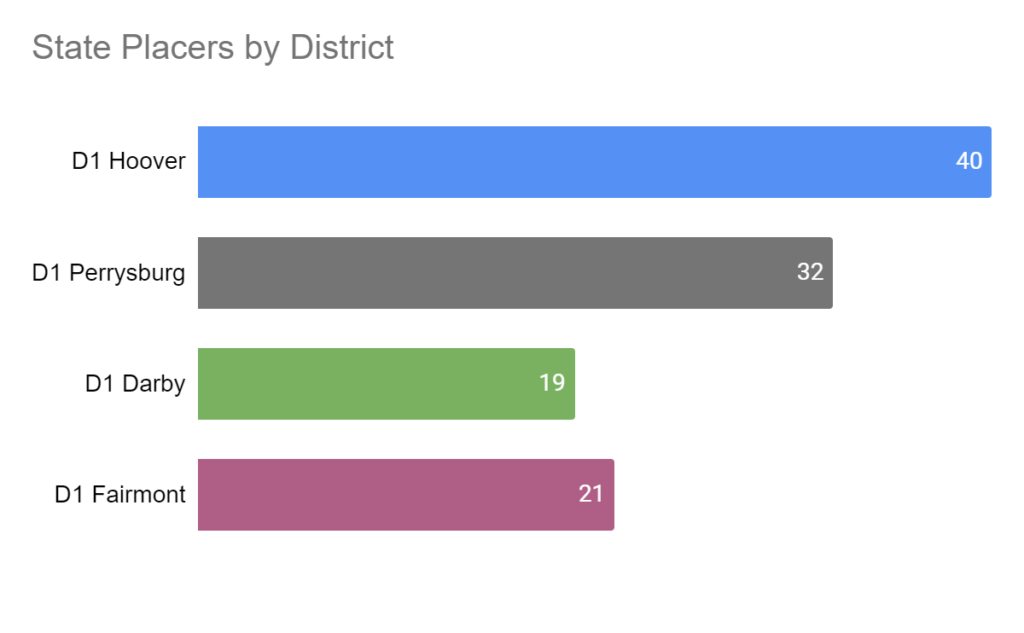
A similar picture is painted by looking at state placers by District.
Hoover is out front with 40 placers – doubling up Darby and Fairmont, while the Perrysburg district came in at 32 state placers – ahead of the average 28 placers per district.
State Placers by School
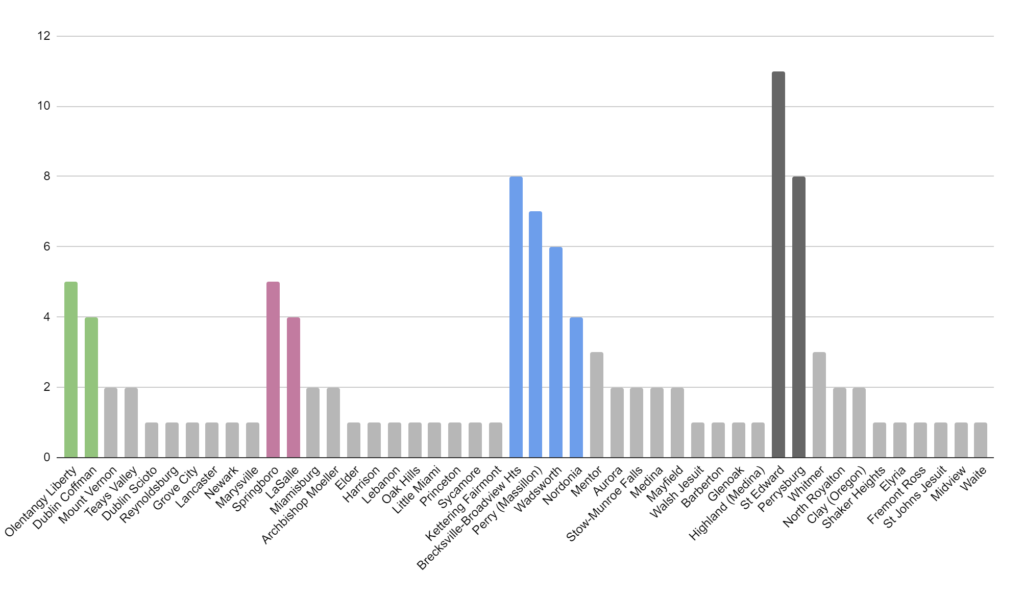
The Perrysburg district is top heavy in terms of both team strength and individual strength – the majority of their qualifiers placed at state and they had the most finalist (14) out of any district. Perrsyburg (the school) and St. Edwards accounting for 19 out of 32 state placers (59%) from their district.
Top teams by number of State placers in the other districts were as follows:
Hoover – Brecksville (8), Massillon Perry (7), Wadsworth (6), Nordonia (4)
Darby – Olentangy Liberty (5), Dublin Coffman (4)
Fairmont – Springboro (5), Lasalle (4)
Sectional Deep Dive
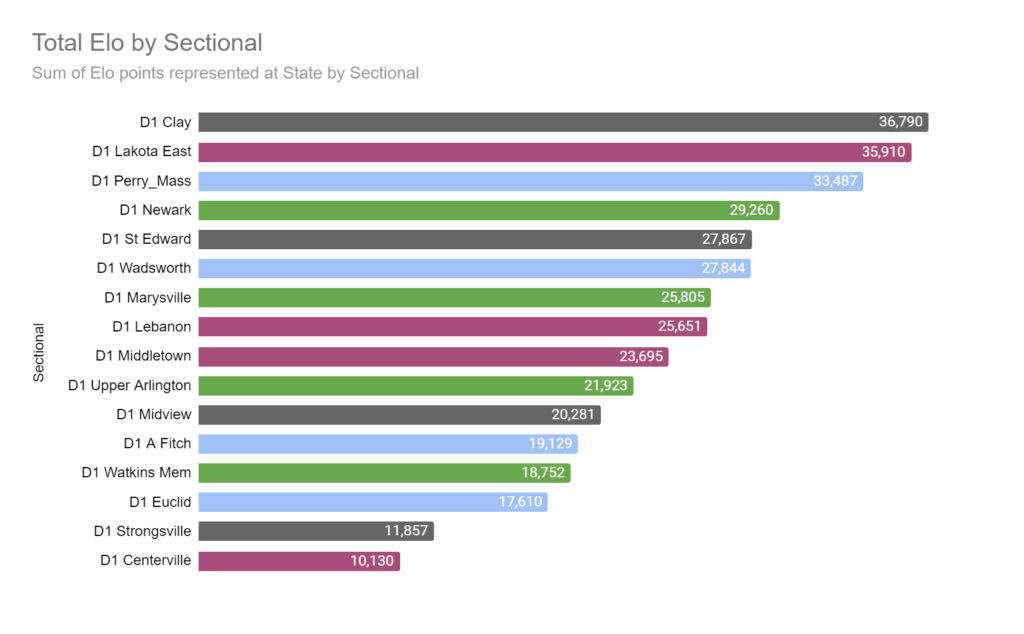
We start with a look at the total Elo points of state wrestlers by sectional which quickly highlights the vast disparities across the state – even within a single district. This metric accounts for both the number of wrestlers and their strength from each sectional.
For example, both feeding the Perrysburg district – the Clay sectional’s total Elo rating was over three times that of Strongsville’s (36,790 vs 11,857).
Lakota East and Centerville sectionals yielded similarly uneven results within the Fairmont district.
Darby’s sectionals displayed a more balanced distribution, with Newark at the top and Watkins Memorial the bottom.
Meanwhile, the Massillon Perry and Wadsworth sectionals dominated the Hoover district, with the Fitch and Euclid sectionals lagging behind.
Placers and Qualifiers by Sectionals
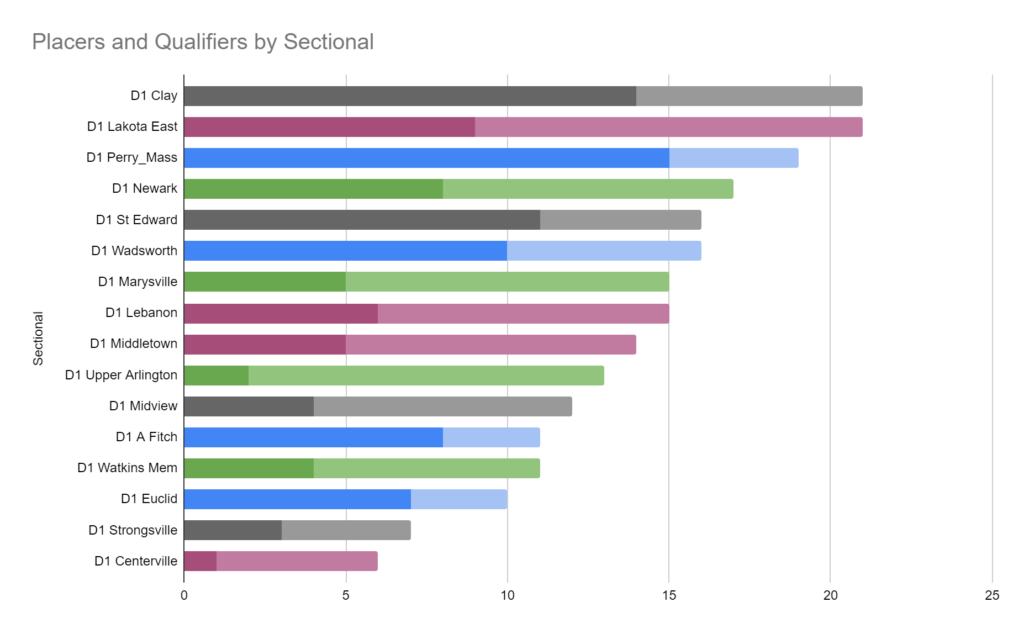
A graphical representation of the placers and qualifiers by sectionals echoes (almost identically) the Elo rating graph’s patterns. Once again, there is a marked difference between the top and bottom performing sectionals across the state and within each district.
State Team Points by Sectional
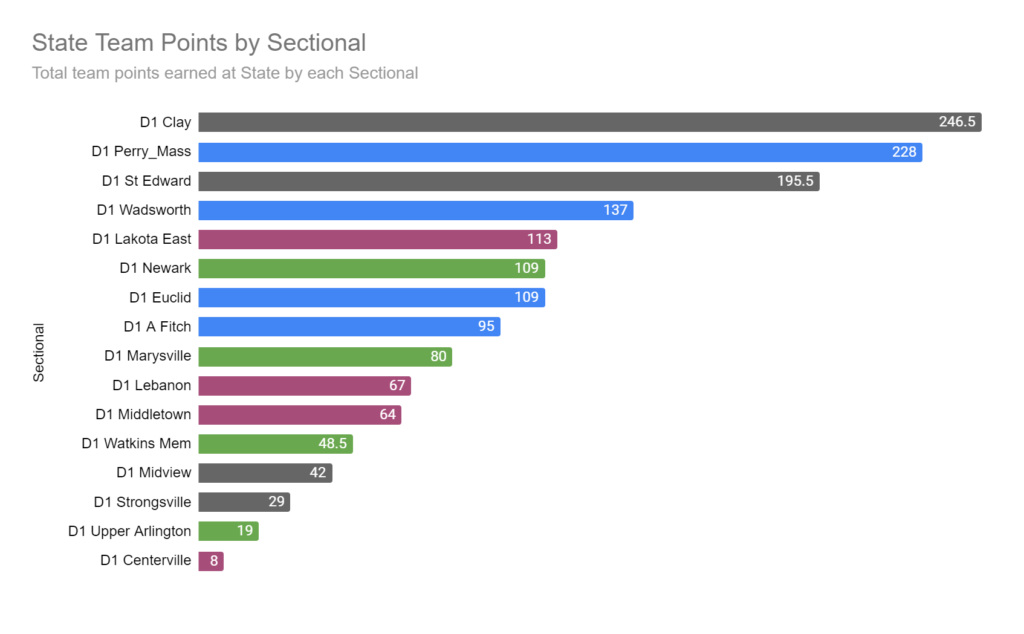
The order changed a bit but Clay remains at the top with 246.5 and Centerville at the bottom with a meager 8 team points scored at the state tournament.
All of the Hover sectionals are in the top half of the distribution while Perrysburg shows a stark contrast between their top two sectionals (Clay and St. Eds) and bottom two (Midview and Strongsville).
Other than Lakota East and Newark, the Darby/Fairmont district’s sectionals are all in the bottom half of the distribution.
Is Action Needed?
Is there a better way to assign sectionals and districts across the state or is the current process serving its purpose?